Images and Bias
What Do Normal People Look Like?
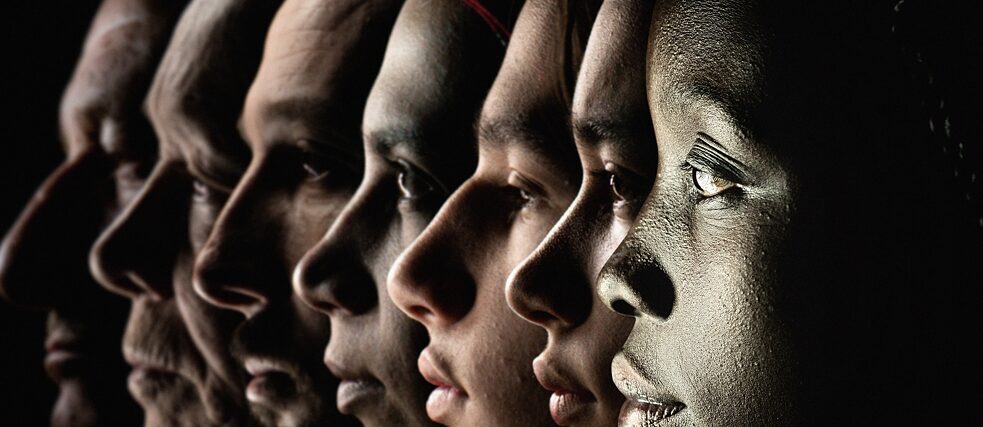
What is normal? And what constitutes a normal face? Our brains are constantly analyzing and classifying every face we encounter, and we as people are not alone in this. A whole field of science and technology analyzes these sub-attentive cognitive processes and breaks them down into statistical normalities. Through machine learning, facial recognition is even being used to categorize and predict human behavior.
By Mushon Zer-Aviv
The Speaking Portrait
Paris changed dramatically during the 19th century, as the Industrial Revolution attracted villagers to try their luck in the big city, starting an urbanization trend that continues to this day. For the first time in their lives, both native Parisians and the new kids on the block found themselves surrounded by new, unfamiliar faces every single day. These demographic changes, together with the rising divide between the industrialist and the worker classes, slowly chipped away at the city’s social fabric. The rising alienation between residents worsened the anxiety in the streets and contributed to a spike in crime.
 If you won’t tell us who you are, your portrait will: The invention of the mugshot made it much easier to identify criminals.
| Photo: © Tableau Synoptic des Traits Physionomiques: pour servir a l’étude du “Porträt Parlé”, by Alphonse Bertillon (1909) / public domain
In earlier times, a policeman would have normally known who they were arresting, where they lived and what their mother would have to say when she heard about her child’s mischief. But the influx of new faces changed that. Police stations began using the emerging technology of photography to document arrests, but these started piling up into unusable and unmanageable mountains of pictures. Young Parisian officer Alphonse Bertillon decided to bring order to the chaos. He started standardizing police arrest photography by taking both a frontal and a side portrait and filing these on a standard arrest card. In other words, he invented the mugshot, what we still see as the iconic image of criminality today. He went on to measure, quantify, and classify the body, augmenting the arrest cards with additional specific identifying data. Bertillon also created a table he called “Le Portrait Parlé”, the speaking portrait, which meant even if the person arrested refused to reveal their identity, their portrait would. The table classified different types of noses, mouths, eyes, ears, and other facial features and systematically categorized them.
If you won’t tell us who you are, your portrait will: The invention of the mugshot made it much easier to identify criminals.
| Photo: © Tableau Synoptic des Traits Physionomiques: pour servir a l’étude du “Porträt Parlé”, by Alphonse Bertillon (1909) / public domain
In earlier times, a policeman would have normally known who they were arresting, where they lived and what their mother would have to say when she heard about her child’s mischief. But the influx of new faces changed that. Police stations began using the emerging technology of photography to document arrests, but these started piling up into unusable and unmanageable mountains of pictures. Young Parisian officer Alphonse Bertillon decided to bring order to the chaos. He started standardizing police arrest photography by taking both a frontal and a side portrait and filing these on a standard arrest card. In other words, he invented the mugshot, what we still see as the iconic image of criminality today. He went on to measure, quantify, and classify the body, augmenting the arrest cards with additional specific identifying data. Bertillon also created a table he called “Le Portrait Parlé”, the speaking portrait, which meant even if the person arrested refused to reveal their identity, their portrait would. The table classified different types of noses, mouths, eyes, ears, and other facial features and systematically categorized them.
For Bertillon it was nothing more than an indexing system to aid in identification. And indeed the “Bertillonage” spread quickly through Europe and the US as the cutting edge scientific best practice for photographic police identification. But just a few years later, much to Bertillon’s disappointment, it was replaced by the fingerprint, which proved to be a much simpler and more accurate identification technology.
What Is Normal?
The study of the fingerprint was among the many scientific contributions of Sir Francis Galton, a prolific British intellectual and a statistics pioneer. Another one of Galton’s major scientific discoveries was that of statistical normality, or normal distribution. It observed that what may seem to be random phenomena often revealed a pattern of probability distributed around a curved peak shaped like a bell – “the bell curve”. These phenomena would mostly coalesce closer to the peak of the bell curve rather than towards the edges.
To demonstrate this fairly abstract statistical phenomenon, Galton built a peculiar device that somewhat resembled a pinball machine and filled it with beans. At the top of the board, the beans were funneled into a single outlet at the center of the board from which they dropped down into an array of pins. The beans bounced around the pins on their way down and finally landed in slots equally distributed along the board’s base. While there is no way to exactly predict which bean would fall into each slot, the overall distribution always repeated the bell curve shape where the center slot contained the most beans and those to its left and right would gradually collect fewer beans.
 Recreation of the Galton box: The falling beans’ distribution always repeats the bell curve.
| Photo: © CC BY-SA 4.0
Quantifying normal distribution also allowed for the quantification of standard deviations – the degree of dispersion across the slots. A low degree of standard deviation (SD) meant the slots were closer to the norm – the peak of the curve. A higher SD meant they were further spread out and abnormalities were more likely to occur.
Recreation of the Galton box: The falling beans’ distribution always repeats the bell curve.
| Photo: © CC BY-SA 4.0
Quantifying normal distribution also allowed for the quantification of standard deviations – the degree of dispersion across the slots. A low degree of standard deviation (SD) meant the slots were closer to the norm – the peak of the curve. A higher SD meant they were further spread out and abnormalities were more likely to occur.
This handy mathematical formulation helped statistical normality become much more than a scientific standard. Galton aspired to use the lens of statistics for every aspect of life, and normality has quickly expanded beyond the context of the natural sciences. Prior to Galton’s work at the end of the 19th century, it was very abnormal to use the word normal to describe anything outside of the realm of the natural sciences. Following Galton’s findings, the concept of normality was itself quickly normalized, and through the work of Émile Durkheim and other sociologists it has permeated the social sciences and culture at large.
Normal Face Or Deviant Face?
In 1893, Galton visited Bertillon’s forensic lab and became a great fan of the Bertillonage. He was not interested in what Bertillon’s tools and methodologies might reveal about individuals’ responsibility for past crimes; Galton was interested in statistically predicting future deviations.
 Photograph and Bertillon record of Francis Galton (age 73) created upon Galton’s visit to Bertillon’s laboratory in 1893.
| Photo: © Wikipedia/gemeinfrei
Like Bertillon, Galton was devoted to the systemic examination of the photographed portrait. Inspired by his findings of statistical normality, Galton invented the technique of composite portraiture. This was the process of photographing different subjects on the same film plate in low exposure, thus producing a single blended image. He created composite portraits of army officers and royal engineers, as well as composite portraits of criminals and the mentally ill. Galton tried to identify what normal people typically looked like and ways to identify and ultimately predict standard social deviations.
Photograph and Bertillon record of Francis Galton (age 73) created upon Galton’s visit to Bertillon’s laboratory in 1893.
| Photo: © Wikipedia/gemeinfrei
Like Bertillon, Galton was devoted to the systemic examination of the photographed portrait. Inspired by his findings of statistical normality, Galton invented the technique of composite portraiture. This was the process of photographing different subjects on the same film plate in low exposure, thus producing a single blended image. He created composite portraits of army officers and royal engineers, as well as composite portraits of criminals and the mentally ill. Galton tried to identify what normal people typically looked like and ways to identify and ultimately predict standard social deviations.
 Galton examined portraits of criminals and of the mentally ill to discover what normal people typically looked like.
| Photo: © Frontispiece of Inquiries into Human Faculty and its Development, Francis Galton (1883) / public domain
For Galton, statistics were more than an intellectual endeavor, as he believed in using statistical normality to create a better society. He founded the eugenics movement that sought to interpret evolution and natural selection (the scientific breakthroughs of Galton’s second cousin, Charles Darwin) as a prescription for creating a better society rather than an analysis of variability in nature. Eugenicists like Galton practiced physiognomy, the pseudoscience of assessing personality traits based on physical appearance – which is like judging a book by its cover. They used Bertillon’s datafication (measuring and recording data) and his classification of the body to also analyze, rank and predict a person’s potential contribution to society and their anticipated impact on future generations’ gene pools. Eugenicists believed that nature, rather than nurture (or God) was the main player in human destiny. Therefore, they argued, the best way to advance the human race was to maintain the purity of heritage and to prevent deviants from bringing children into this world. Eugenic policies were advanced all through Western Europe and the UK, but it was the American eugenicists who were first to pass sterilization laws to keep the disabled from having children.
Galton examined portraits of criminals and of the mentally ill to discover what normal people typically looked like.
| Photo: © Frontispiece of Inquiries into Human Faculty and its Development, Francis Galton (1883) / public domain
For Galton, statistics were more than an intellectual endeavor, as he believed in using statistical normality to create a better society. He founded the eugenics movement that sought to interpret evolution and natural selection (the scientific breakthroughs of Galton’s second cousin, Charles Darwin) as a prescription for creating a better society rather than an analysis of variability in nature. Eugenicists like Galton practiced physiognomy, the pseudoscience of assessing personality traits based on physical appearance – which is like judging a book by its cover. They used Bertillon’s datafication (measuring and recording data) and his classification of the body to also analyze, rank and predict a person’s potential contribution to society and their anticipated impact on future generations’ gene pools. Eugenicists believed that nature, rather than nurture (or God) was the main player in human destiny. Therefore, they argued, the best way to advance the human race was to maintain the purity of heritage and to prevent deviants from bringing children into this world. Eugenic policies were advanced all through Western Europe and the UK, but it was the American eugenicists who were first to pass sterilization laws to keep the disabled from having children.
Bertillon himself never meant for his technology to be used in this way. When confronted with the scientific racism theories of contemporary Italian criminologist, Cesare Lombroso, Bertillon said: “No; I do not feel convinced that it is the lack of symmetry in the visage, or the size of the orbit, or the shape of the jaw, which make a man an evil-doer.”
Bertillon argued that he saw a very wide distribution of faces go through his forensics lab. And that an eye defect, for example, did not indicate the person was born a criminal, but that his poor eyesight may have left him few alternatives on the job market.
Bertillon was datafying the body to identify and correlate past behavior, not to project and predict future acts. Yet, the same datafication and classification of behavior and personal traits allowed for both forensic identification and statistical prediction. Scientific racism and physiognomy went on to shape the 20th century. In his book Mein Kampf, Adolf Hitler refers to American eugenicists as a major source of inspiration for what Germany later developed into Nazi eugenics. The Nazis pushed this philosophy and practice to its horrific extreme with the mass exterminations and genocide of Jews, Romani, homosexuals, disabled people, and others marked as deviations from the normalized racist Aryan image. After the Nazi defeat in World War II, the ideas of physiognomy and scientific racism received international condemnation. In the following years they lay dormant underneath the surface, but they did not evaporate, for they were deeply embedded in the heritage of statistical normality.
The Portrait Speaks Again
Facial analysis made a dramatic comeback in the second decade of the 21st century powered by the latest advancements in computer-enhanced statistics. Today’s “data scientists” are the direct intellectual descendants of the 19th century statistics and datafication pioneers. Some of them focus on identification, updating Bertillon’s attempts to forensically identify individuals by correlating data with past documentation. Others, like Galton, focus on analysis, attempting to statistically project future behavior based on patterns from the past. Today both identification and projection are often used in combination in an attempt to exploit the technology to the fullest extent. For example, in November 2021 after pressure from regulators, Facebook announced it would stop using facial recognition to identify users in pictures and said it would implement its “Automatic Alt Text” service that analyzes images to automatically generate a text description of content.
Data centers are accumulating more and more data. They create an ever more detailed portrait of our past behavior that feeds the algorithmic predictions of our future behavior. Much like Galton’s composite portraiture, the image of normal behavior is constructed from multiple superimposed samples of different subjects. Every bean of data is funneled through algorithmic black boxes to find its way into the normally distributed slots along the bell curve of future normalized behavior. Normalization through data becomes a self-fulfilling prophecy. It not only predicts the future; it dictates the future. When the predicted path is the safest bet, betting on deviation becomes both a financial, a cultural, and sometimes a political risk. This is how data-driven predictions normalize the past and prevent change. Machine learning algorithms are therefore conservative by design, as they can only predict how patterns from the past will repeat themselves. They cannot predict how these patterns may evolve.
The discourse on online privacy still informs the discussion around a person’s right to keep their past activities private. But today’s algorithmic surveillance apparatuses are not necessarily interested in our individual past activities. They are interested in the image revealed by our composite portraits – the one that defines the path of normality and paints deviations from the norm as suspicious.
Online Normalizi.ng
Like machines, as people we are also constantly categorizing the faces of others. We capture, classify and analyze each other’s physiognomic features. But are we aware of our daily biases, of the way we constantly define what is normal and what is not? How do we categorize people and how are we categorized? That’s what the Normalizi.ng project is all about. It is an experimental online research project using machine-learning that aims to analyze and understand how we decide who looks more “normal”.
Participants in the Normalizi.ng web experience go through 3 steps that are common to both early and contemporary statistics. In the first step – capture – they are encouraged to insert their faces into a frame and capture a selfie. In the second step – classify – they are presented with a series of previously recorded participants. They then swipe right and left to classify which of a pair of noses, mouths, eyes, and faces looks more “normal”. In the third step – analyze – the algorithm analyzes their faces and their normalization swipes. It files them in a Bertillonage inspired arrest card with dynamic normalization scores and then adds their faces to a Portrait Parlé inspired algorithmic map of normality.
 The Normalizi.ng Map
| The Normalizi.ng Map
The map uses a face analysis algorithm to cluster faces with similar features on a two-dimensional grid. The higher the normality score, the thicker the portrait frame. Every hour, as more participants join, the algorithm updates and redraws the map. Yet in every map the two main clusters are always clearly identified as male and female. Other clusters are formed in the margins: a dark-skinned cluster, often unified for both male and female, an Asian cluster, sometimes transitioning gradually to a Latinx one. A child cluster, an elderly cluster, a bearded cluster... Interestingly, pandemic-masked faces are distributed evenly throughout the map. While the algorithmic maps are constantly redrawn, they repeat and amplify the divisions of face classification. They visualize how today’s systematic discrimination in societies around the world – against people of certain genders, skin colors, ages or hair styles – is aggregated, amplified, and conveniently hidden behind the seemingly objective black box of artificial intelligence.
The Normalizi.ng Map
| The Normalizi.ng Map
The map uses a face analysis algorithm to cluster faces with similar features on a two-dimensional grid. The higher the normality score, the thicker the portrait frame. Every hour, as more participants join, the algorithm updates and redraws the map. Yet in every map the two main clusters are always clearly identified as male and female. Other clusters are formed in the margins: a dark-skinned cluster, often unified for both male and female, an Asian cluster, sometimes transitioning gradually to a Latinx one. A child cluster, an elderly cluster, a bearded cluster... Interestingly, pandemic-masked faces are distributed evenly throughout the map. While the algorithmic maps are constantly redrawn, they repeat and amplify the divisions of face classification. They visualize how today’s systematic discrimination in societies around the world – against people of certain genders, skin colors, ages or hair styles – is aggregated, amplified, and conveniently hidden behind the seemingly objective black box of artificial intelligence.
Unfamiliar faces are a major part of what makes Paris and so many other big cities so exciting, so full of possibilities. Paris will never be a small homogeneous town again. Neither will the internet. The algorithm is the cop who sees you only through your stereotype, never really knowing you as a person, never talking to your mother. Let us stop and ask ourselves, is that something we want to systematize? To automate? To amplify? And anyway, is normality even something we should be policing?
The panel (Mis)Reading Human Emotions – with Mushon Zer-Aviv – at the festival When Machines Dream the Future